By Sithu Aung and Dalfany Cruz
What is MaC?
Thanks to the astonishing advancement in DevOps technologies and best practices, we are now at a point where we can issue several releases per day. It’s not unusual to see ten or more pushes to production in a single day, sometimes in an hour. Therefore, it is now more important than ever to have the proper tools for monitoring in place. At LiveRamp, we have adopted “monitoring as code” or “MaC.”
“MaC” follows the same principle as “infrastructure as code.” Essentially, monitors are provisioned the same way as infrastructure by using high-level syntax to create and manage monitors and alerts with the added benefit of having the entire process versioned, accessible, and reusable.
Problems
Let’s step back and look at the challenges we had when it came to monitoring, and probably the challenges of many engineers as well.
The SRE team is responsible for the reliability and availability of 17 different projects within the company and is expanding to more. We are a global team working on different time zones, hence communication and coordination is a challenge. Our approach to monitoring as code had to be straightforward, explicit in intent, and easy to use. A new member should be able to create a new monitor within minutes without obstacles and without the need of reading documentation.
Our first journey into monitoring and observability was to manually create the monitors using Datadog. Each team from each zone would manage their own sets of monitors in isolation. We would each go into the Datadog UI, create a new monitor or clone someone else’s monitor, in hope it was accurate and followed best practices. We can see two problems with this practice:
- Everyone was creating their own version of a monitor, making it difficult to have a unified and cohesive set of monitors. There was no guideline, no best practice, no peer review, and no history of changes.
- It is a very painful experience to manually manage hundreds of monitors. It was not scalable as we grew in number of team members and services offered by LiveRamp.
Another key issue is that during the CI/CD process, we often treat monitoring as an afterthought. Engineers are focused on making the best application they can build and often let monitoring those applications slide during deployment. This is due to the effort it takes to create a basic health check, lack of knowledge, or lack of time in general.
What is LiveRamp MaC?
There are many approaches and levels of complexity we can adopt in order to solve the challenges above. When we started this initiative, our self-imposed requirements were to:
- Use Terraform and Datadog.
- Create a community-based set of modules where every team could collaborate to create new modules, improve existing ones, and fact-check the logic and metrics.
- Accommodate different use cases.
- Version the modules to avoid breaking live monitors when we make changes.
- Make it extremely easy to use, since the goal is for each engineer to start monitoring their applications right away.

By using Terraform and Datadog to programmatically create and manage our monitors, we fulfilled requirement number one.
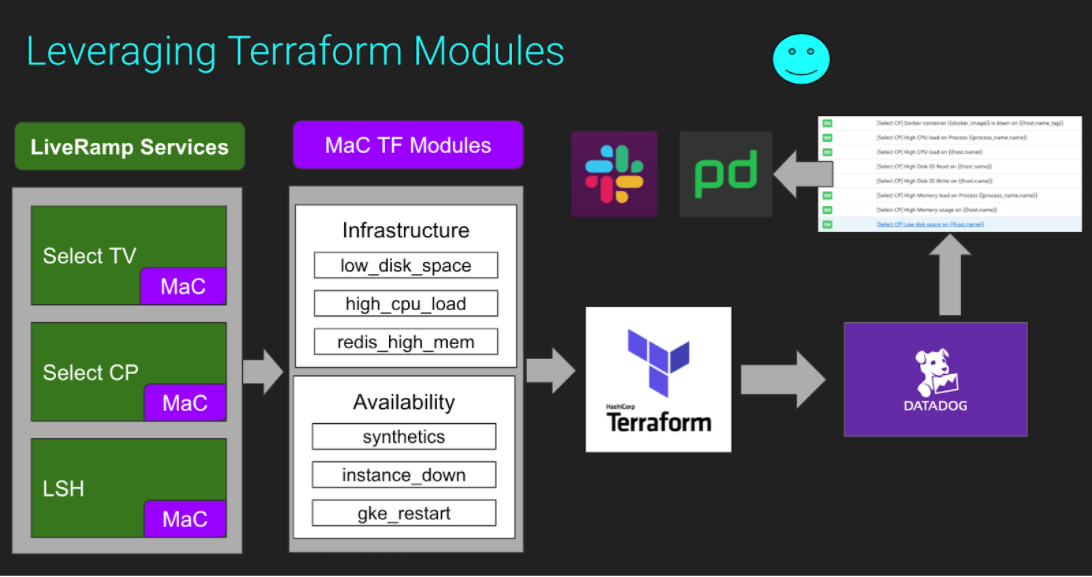
We also took it a step further and built a platform that offers a catalog of monitors (“modules” in Terraform lingo) that can be easily discoverable and reusable. The approach is: you write the module once and any number of teams can make use of it without reinventing the wheel or worrying too much about low-level details.
How to convert existing monitors to MaC
To create a new monitor, you simply have to decide what to monitor, source the module, and pass needed arguments relevant to your project.

If the values provided by default by the module don’t satisfy your needs or you need to customize certain bits, you can do so as well:

The modules available out of the box are organized into different categories. For example: apm (application performance monitoring), infrastructure, availability, uptime, custom metrics, etc.
The modules have two main files: main.tf and variables.tf. The variables file contains the variables and arguments used by the provider’s resource with default values. It also hosts custom variables used for internal logic. The main.tf files are where the resource is created:

By leveraging Terraform’s modules, we can now enjoy the following advantages:
- Reusability – The modules can be reused by any project. The monitor only needs to be coded once and can be reused by everybody.
- Flexibility – The modules can be customized according to your needs. You can set your own threshold, name, tag, and any other arguments available.
- Extensibility – Easy to add new functionality or modify existing functionality.
- Scalability – Manage hundreds of monitors on-the-fly and programmatically, eliminating intensive manual work.
- Version control – Track, peer review, and safely apply all changes.
- A well-established workflow – All teams within LiveRamp can now have a set of guidelines and/or requirements to follow and apply.
