
LiveRamp engineering has a world-class infrastructure organization that supports the company’s developers who deal with big data on a daily basis. The quality and reliability team has standardized best practices for production monitoring dashboards to inspect, identify, and eliminate defects at the earliest time possible to reduce customer impact.
The challenge
There are several monitoring dashboards available in Datadog for infrastructure monitoring and service/component monitoring. However, there are some gaps between what Datadog offers and what LiveRamp needed:
- Missing centralized cross-component or integrated product dashboards showcasing business use case failures
- The current monitor and alert system helps on-call engineers resolve issues but provides less visibility to cross-teams, technical support engineers, and engineering leadership on product and component overview
- Needed a baseline defined for product/service monitoring dashboards so that all teams have common and minimal dashboards defined for their services
LiveRamp’s needs
- Stability: Dashboards need to highlight the reliability and stability of the services, infrastructure, and product to gain actionable insights from a unified view of product reliability
- Visualization: Quality and reliability teams need to define robust dashboards that can visualize data/file-processing failures, workflow failures, and business use case failures so that operators are alerted when things appear to be broken
- Standardization: Define a minimal set of dashboards that every service or component should have
- Actionable alerts: Prevent alert fatigue and provide actionable alerts
LiveRamp engineering’s production monitoring dashboard design:
The immense value of a production monitoring dashboard is that any member of product or engineering can see the historical service availability for automated alerting sent to PagerDuty. A project manager or engineer can view uptime of services and status of production incidents at any moment in time.
Considerations for the design of a production monitoring dashboard
From the perspective of an engineer who might be involved in an incident response, here are a few examples of LiveRamp’s historical experiences:
- Internal uncertainty about service degradation: A team experienced a backlog of requests which created cascading backlogs in downstream teams due to latency issues. A long thread ensued in the provider’s Slack channel to confirm the backlog in that service, which caused ripple effects for the rest of the company.
- A customer detected a failure before we did: A LiveRamp customer observed a problem on their site where our production service is involved (e.g. pixel server unresponsive or not redirecting appropriately). The customer escalated the issue to their customer service manager (CSM), who escalated to technology services (TS), who located the engineering team responsible by manually reaching out to the on-call (OC) engineer for that team to remediate.
- An engineering team had dashboards but not monitors: When an issue occurred with a production service, an engineering team consulted a large custom dashboard to track problems with their production service. However, these dashboards were not accompanied by monitors, so when things went wrong, human intervention was required to raise a concern first, after which the dashboard was consulted (again, manually) to validate the problem. This was a very inefficient process.
These scenarios were avoidable with the right design in place. In the following sections, we’ll lay out the steps that were required to meet our goals by collaboratively aligning as much of the engineering organization as possible to have greater effect. We accomplished this by reassuring our engineering teams that we could achieve our goals with a relatively small amount of effort by intelligently leveraging tools that our organization has already purchased
Production Monitoring dashboard:
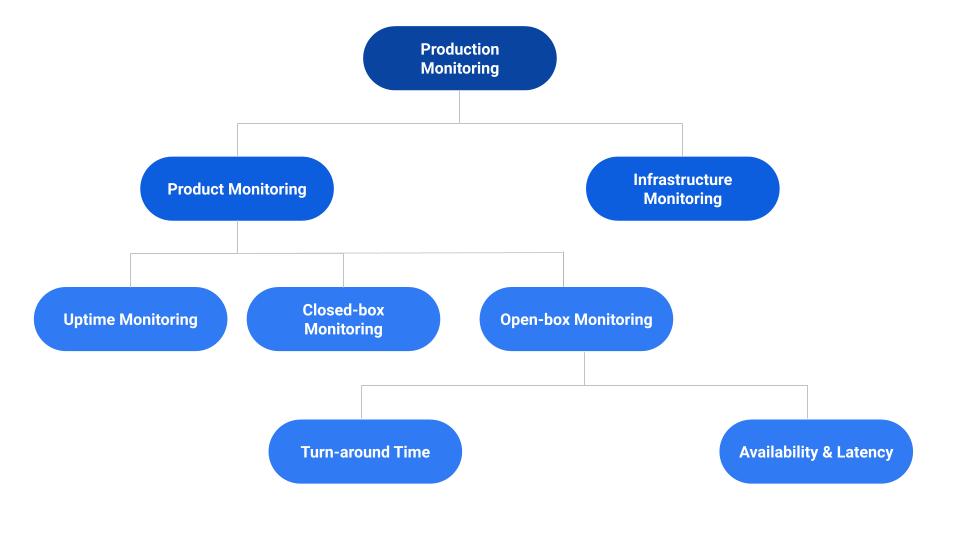
Based on aforementioned considerations, we have categorized LiveRamp monitoring dashboards into the following two types:
- Infrastructure monitoring:
- Monitor the health or performance of host machines/nodes/clusters based on CPU, memory, disk space, daemons, and process utilization or performance.
- Monitor networking layers by looking at connectivity, error rates and packet loss, latency, bandwidth utilization, etc.
- Product monitoring:
- Monitor product features, service availability, real-time user request tracking, service-level objective (SLO) violations, etc.
Below are the product monitoring highlights:
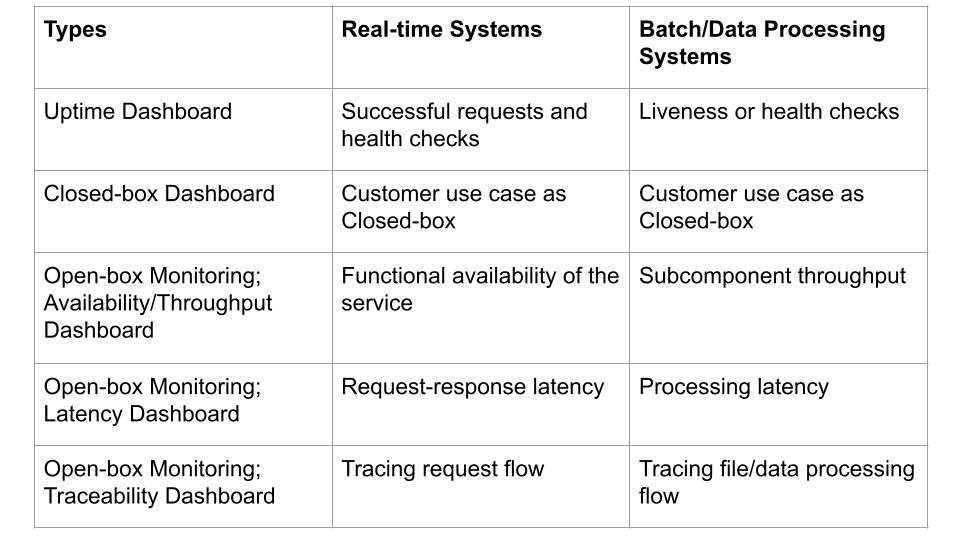
Uptime dashboard
Service/application uptime dashboard helps track the current state of the service based on production traffic. The health of the services and processes can be tracked using liveness or readiness checks or by generating synthetic requests. These checks help narrow down to the broken component or stage in the pipeline.
Given that customer-facing applications and services have a direct impact on business flows when the services are not accessible, an uptime dashboard provides historical data while the respective monitors alert us when the systems are down so that it can be recovered at the earliest opportunity and provide better customer experience.
Read more on uptime monitoring in our series of production monitoring blogs.
Closed-box monitoring
Closed-box monitoring is where you don’t have control over the internal components of the system and only monitor the system from the outside. For example, testing and monitoring externally visible behavior as a user would see it. It observes the external state of the system or component and aligns with the user experience of the product.
End-to-end tests are the type of testing that can be used to simulate end-user scenarios. As we are generating synthetic traffic, these tests help us detect broken pipeline flow and thereby find the services or applications that are running but are not processing requests or files.
Dashboards can be published based on the test reports generated from the test frameworks. This dashboard helps us narrow down the business use cases that are broken and visualize the number of customer-impacted days.
Also, Closed-box monitoring helps identify issues in the deployed features of the service while we are working on quality initiatives to qualify new changes and detect bugs during the development cycle.
Note: Closed-box monitoring dashboards alert us when the product pipeline is broken but they don’t help us find the root cause of the problem.
Read more on Closed-box monitoring in our series of production monitoring blogs.
Open-box monitoring
Traceability dashboards (aka Open-box monitoring) help in understanding upstream and downstream relationships and how request/file processing propagates across a distributed system, and it relies heavily on measuring the internal state of the component. This Open-box monitoring can be done based on the metrics exposed by the internals of the system, including logs, interfaces like JVM profiling, HTTP handlers that emit internal statistics, or events that summarize the state of back-end processing.
This provides a detailed understanding of the system state by tracking the data/file processing flow and is helpful for identifying the root cause of the problem and thereby provides actionable insights. It also helps developers understand when/where the flow is broken or slow along with the latency of each step.
Traceability dashboards are comprehensive and are more useful not only in debugging and root-cause analysis, but also to provide a summarized view of product reliability.
Read more on Open-box monitoring in our series of production monitoring blogs.
We hope this helps others in their infrastructure journey.
LiveRamp is hiring—come join us! Subscribe to our blog to get the latest LiveRamp Engineering news!